
The utility of socioeconomic and remoteness indicators
in understanding the geographical variation in the regional prevalence of early
childhood vulnerability in Australia
Bernard Baffour, Mu Li, Sumonkanti Das, Alice Richardson
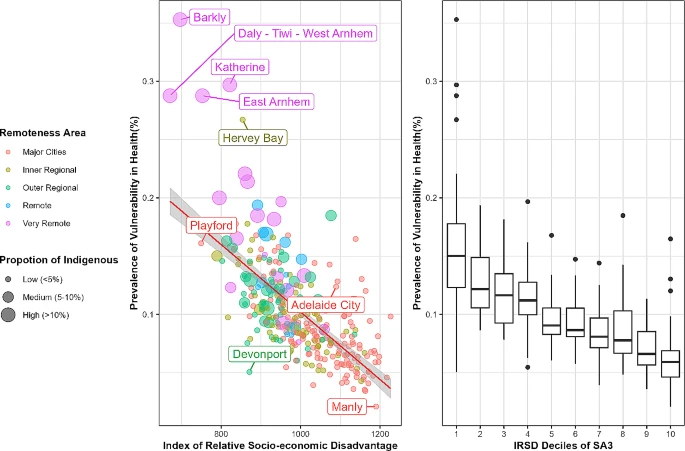
The family lives of children and their early childhood development outcomes are attributable to the level of socio-economic disadvantage and relative isolation. This study aims to investigate how the disadvantage of the local area (i.e., socio-economic indexes for areas (SEIFA)) and the remoteness (i.e., accessibility/remoteness index of Australia (ARIA)) contribute to improved prevalence estimates of child development vulnerability in statistical areas level 3 (SA3) and 4 (SA4) across Australia. Data from the 2018 Australian Early Development Census (AEDC) has been used. The study included 308,953 children involved in the AEDC 2018 where one-in-ten of them were considered to be developmentally vulnerable, nationally. We developed models in a hierarchical Bayesian framework at the SA3 level using SEIFA and ARIA indices as covariates to account for spatial and unobserved heterogeneity. The performances of developed models are examined based on the consistency at SA3, SA4, and state level. The results reveal that SEIFA makes a significant contribution to explaining the spatial variation in childhood development vulnerability across small domains in Australia. Further, the inclusion of the ARIA score improves the model performance and provides better accuracy, particularly in remote and very remote regions. In these regions, the spatial model fails to distinguish the remoteness characteristics. The chosen non-spatial model accounting for heterogeneity at higher hierarchies performs best. The utilization of socio-economic disadvantage and geographic remoteness of the finer level domains helps to explain the geographic variation in child development vulnerability, particularly in sparsely populated remote regions in Australia.
This research was used to support the opinion piece Bernard wrote for the ABC here.
Trend estimation of sub-national level daily smoking prevalence by age and sex in Australia
Sumonkanti Das, Bernard Baffour, Alice Richardson
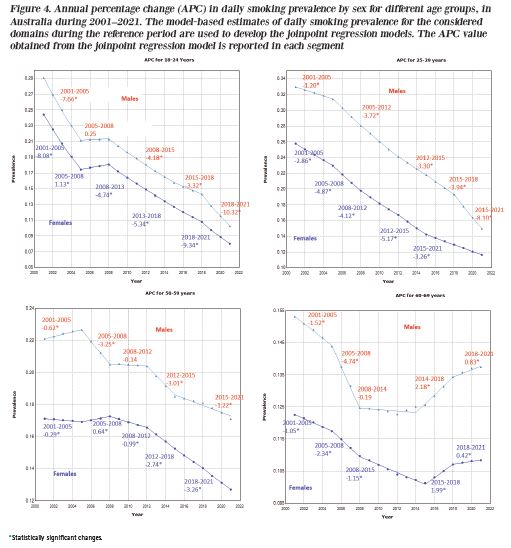
Despite that the smoking prevalence has considerably declined in Australia after successful public health strategies over many decades, smoking is still the leading cause of preventable diseases and death in Australia. These declines have not occurred consistently across all geographical–demographic domains. In order to provide an evidence base for monitoring the trend towards the goal of reducing smoking across all domains in Australia, this study aims to estimate trends of smoking prevalence for small domains cross-classified by seven age groups (18–24, 25–29, 30–39, 40–49, 50–59, 60–69, and ≥70 years), two genders, and eight states and territories over twenty years (2001–2021).
Direct estimates of smoking prevalence for the target small domains were calculated from the micro-data of the Australian National Health Surveys conducted in seven rounds during 2001–2021. The obtained direct estimates were then used as input for developing time-series models expressed in a hierarchical Bayesian structure as a form of small-area estimation. The developed models borrow cross-sectional, temporal, and spatial strength in such a way that they
can interpolate smoking levels in the non-survey years for all detailed level small domains. Smoothed trends of smoking prevalence for higher aggregation levels are obtained by aggregation of the detailed level trend predictions.
Model-based small area estimators provide consistent and reasonable smoothed trends at both detailed and higher aggregation levels. Results show that the national-level trend exhibits a steeper linear decline over the study period, from 24% in 2001 to 12% in 2021, with a considerable gender difference of around 5% over the period, with males reporting a higher prevalence. Improved model-based estimates at the state level and by age also show steady declines in trends except for the Northern Territory (still above 20%) and older age groups 60–69 and ≥70 years (declining trends remain stable after 2012).
The findings of the study identify the geographical–demographic groups that had poor improvement over the period 2001–2021, and are still behind the target of achieving lower smoking prevalence. These, in turn, will help health researchers and policymakers deliver targeted programs to the most vulnerable, enabling the nation to meet its health goals in a timely way.
Bernard Baffour, Justice Moses K. Aheto, Sumonkanti Das, Penelope Godwin, Alice Richardson
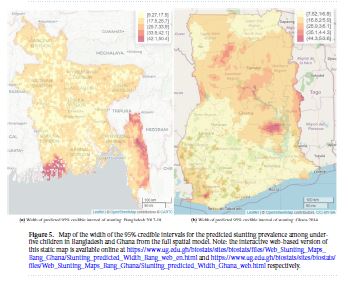
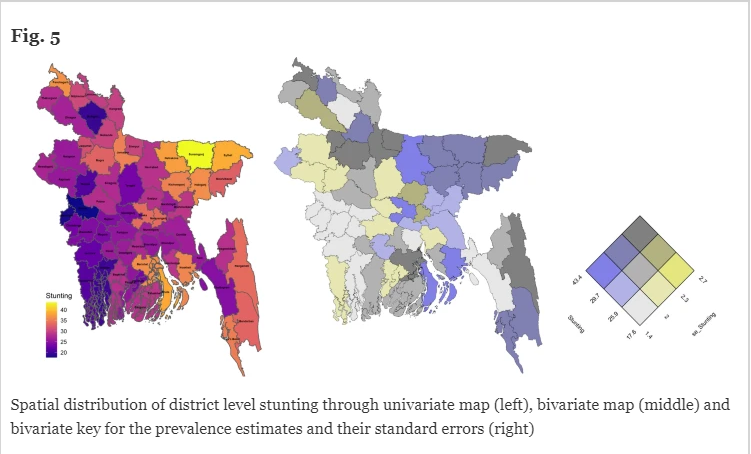
Childhood chronic undernutrition, known as stunting, remains a critical public health problem globally. Unfortunately while the global stunting prevalence has been declining over time, as a result of concerted public health efforts, there are areas (notably in sub-Saharan Africa and South Asia) where progress has stagnated. These regions are also resource-poor, and monitoring progress in the fight against chronic undernutrition can be problematic. We propose geostatistical modelling using data from existing demographic surveys supplemented by remote-sensed information to provide improved estimates of childhood stunting, accounting for spatial and non-spatial differences across
regions. We use two study areas–Bangladesh and Ghana–and our results, in the form of prevalence maps, identify communities for targeted intervention. For Bangladesh, the maps show that all districts in the south-eastern region are identified to have greater risk of stunting, while in Ghana the greater northern region had the highest prevalence of stunting. In countries like Bangladesh and Ghana with limited resources, these maps can be useful diagnostic tools for health planning, decision making and implementation.
Bernard Baffour
John Dunne and Li-Chun Zhang’s paper appears in the Journal of the Royal Statistical Society Series A. As is the tradition in the RSS, certain papers are “read” to the Society and Fellows contribute to the discussion of the paper. Bernard’s contribution concerns the use of the trimmed dual system estimator (DSE) method to deal with erroneous records or over-coverage, which appears to be a stumbling block for national statistical offices with an under-developed registry system in their country.

Joshua J. Bon, Adam Bretherton, Katie Buchhorn, Susanna Cramb, Christopher Drovandi, Conor Hassan, Adrianne L. Jenner, Helen J. Mayfield, James M. McGree, Kerrie Mengersen, Aiden Price, Robert Salomone, Edgar Santos-Fernandez, Julie Vercelloni and Xiaoyu Wang
Building on a strong foundation of philosophy, theory, methods and computation over the past three decades, Bayesian approaches are now an integral part of the toolkit for most statisticians and data scientists. Whether they are dedicated Bayesians or opportunistic users, applied professionals can now reap many of the benefits afforded by the Bayesian paradigm. In this paper, we touch on six modern opportunities and challenges in applied Bayesian statistics: intelligent data collection, new data sources, federated analysis, inference for implicit models, model transfer and purposeful software products.

Trends in chronic childhood undernutrition in Bangladesh for small domains
Sumonkanti Das, Bernard Baffour, Alice Richardson
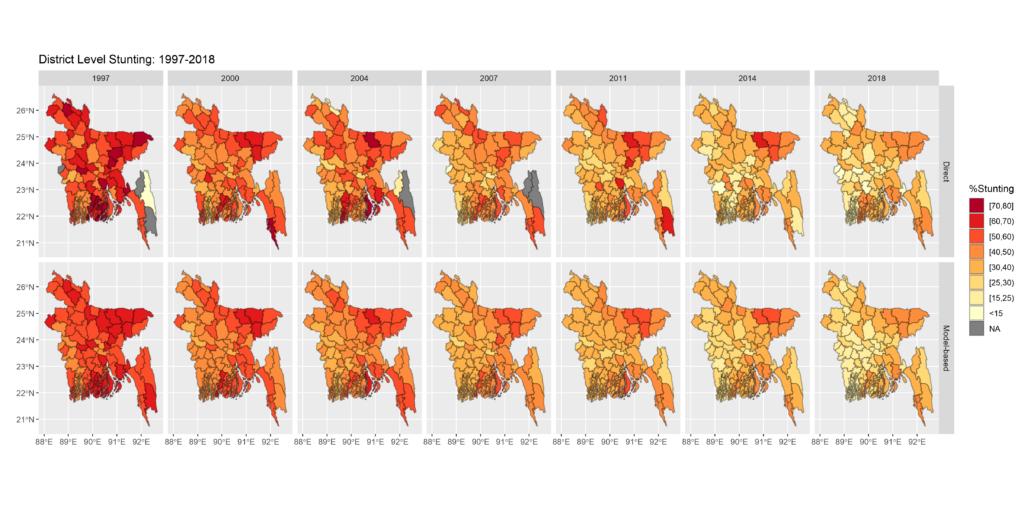
Chronic childhood undernutrition, known as stunting, is an important population health problem with short- and long-term adverse outcomes. Bangladesh has made strides to reduce chronic childhood undernutrition, yet progress is falling short of the 2030 Sustainable Development Goals targets. This study estimates trends in age-specific chronic childhood undernutrition in Bangladesh’s 64 districts during 1997–2018, using underlying direct estimates extracted from seven Demographic and Health Surveys in the development of small area time-series models. These models combine cross-sectional, temporal, and spatial data to predict in all districts in both survey and non-survey years. Nationally, there has been a steep decline in stunting from about three in five to one in three children. However, our results highlight significant inequalities in chronic undernutrition, with several districts experiencing less pronounced declines. These differences are more nuanced at the district-by-age level, with only districts in more socio-economically advantaged areas of Bangladesh consistently reporting declines in stunting across all age groups.
[in preparation] Estimation of daily smoking prevalence for disaggregated statistical areas in Australia
Sumonkanti Das, Bernard Baffour, Alice Richardson, Susanna Cramb, Stephen Haslett
SA 4 smoking prevalence interactive map
SA 3 smoking prevalence interactive map
Sumonkanti Das, Bernard Baffour, Alice Richardson
Micro-level statistics on child undernutrition are highly prioritized by stakeholders for measuring and monitoring progress on the sustainable development goals. In this regard district-representative data were collected in the Bangladesh Multiple Indicator Cluster Survey 2019 for identifying localised disparities. However, district-level estimates of undernutrition indicators – stunting, wasting and underweight – remain largely unexplored. This study aims to estimate district-level prevalence of these indicators as well as to explore their disparities at sub-national (division) and district level spatio-demographic domains cross-classified by children sex, age-groups, and place of residence. Bayesian multilevel models are developed at the sex-age-residence-district level, accounting for cross-sectional, spatial and spatio-demographic variations. The detailed domain-level predictions are aggregated to higher aggregation levels, which results in numerically consistent and reasonable estimates when compared to the design-based direct estimates. Spatio-demographic distributions of undernutrition indicators indicate south-western districts have lower vulnerability to undernutrition than north-eastern districts, and indicate significant inequalities within and between administrative hierarchies, attributable to child age and place of residence. These disparities in undernutrition at both aggregated and disaggregated spatio-demographic domains can aid policymakers in the social inclusion of the most vulnerable to meet the sustainable development goals by 2030.
Saurav Guha, Sumonkanti Das, Bernard Baffour, Hukum Chandra
District-representative data are rarely collected in the surveys for identifying localised disparities in
Bangladesh, and so district-level estimates of undernutrition indicators – stunting,wasting and underweight
– have remained largely unexplored. This study aims to estimate district-level prevalence of these indicators
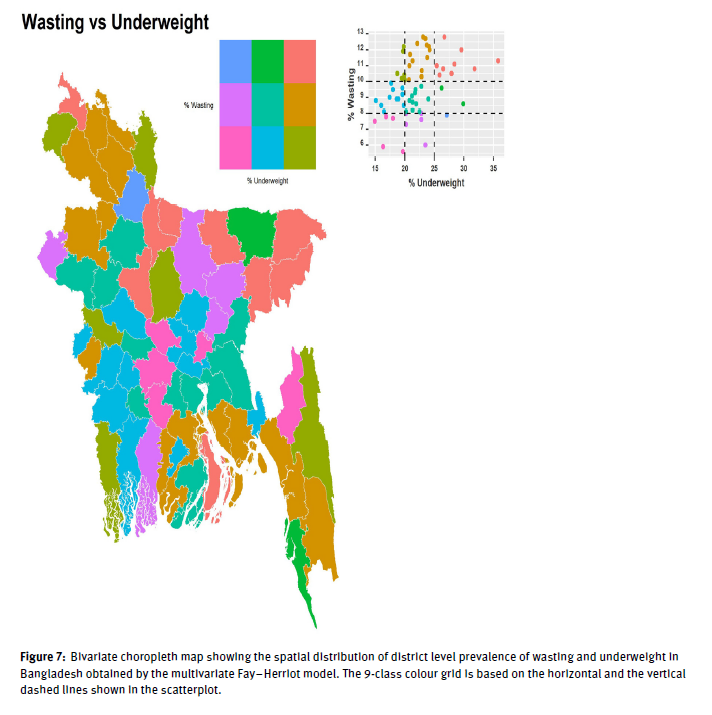
by employing a multivariate Fay–Herriot (MFH) model which accounts for the underlying correlation among
the undernutrition indicators. Direct estimates (DIR) of the target indicators and their variance–covariance
matrices calculated from the 2019 Bangladesh Multiple Indicator Cluster Survey microdata have been used
as input for developing univariate Fay–Herriot (UFH), bivariate Fay–Herriot (BFH) and MFH models. The
comparison of the various model-based estimates and their relative standard errors with the corresponding
direct estimates reveals that the MFH estimator provides unbiased estimates with more accuracy than the
DIR, UFH and BFH estimators. The MFH model-based district level estimates of stunting, wasting and underweight
range between 16 and 43%, 15 and 36%, and 6 and 13% respectively. District level bivariate maps of
undernutrition indicators show that districts in north-eastern and south-eastern parts are highly exposed to
either form of undernutrition, than the districts in south-western and central parts of the country. In terms
of the number of undernourished children, millions of children affected by either form of undernutrition
are living in densely populated districts like the capital district Dhaka, though undernutrition indicators (as
a proportion) are comparatively lower. These findings can be used to target districts with a concurrence of
multiple forms of undernutrition, and in the design of urgent intervention programs to reduce the inequality
in child undernutrition at the localised district level.
Multilevel time series modelling of mobility trends in the Netherlands for small domains
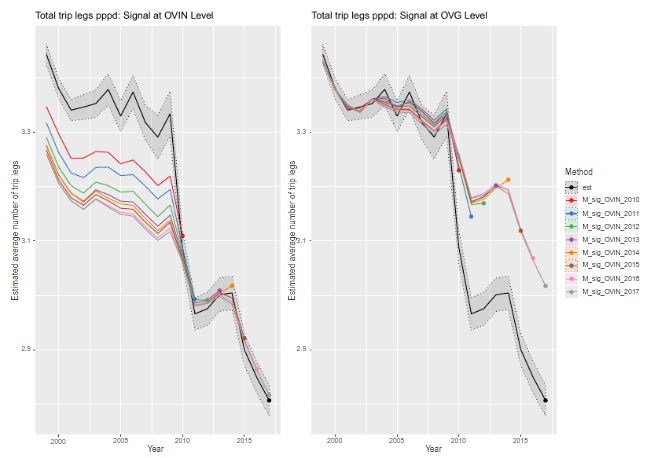
Harm Jan Boonstra, Jan van den Brakel, Sumonkanti Das
The purpose of the Dutch Travel Survey is to produce reliable estimates on mobility of the Dutch population. In this paper mobility trends are estimated at several aggregation levels, using multilevel time series models. The models account for discontinuities induced by two survey redesigns and outliers due to less reliable outcomes in one particular year. The input for the model is direct annual estimates with their standard errors for the period 1999–2017 for a detailed cross-classification in 504 domains. Appropriate transformations for the direct estimates and generalized variance functions to smooth the standard errors of the direct estimates are proposed. The models are fitted in an hierarchical Bayesian framework using MCMC simulations. From the model outputs smooth trend estimates are computed at the most detailed domain level. Predictions at higher aggregation levels obtained by aggregation of the most detailed domain predictions result in a numerically consistent set of trend estimates for all target variables.
Regression trees for poverty mapping
Penelope Bilton, Geoff Jones, Siva Ganesh, Stephen Haslett
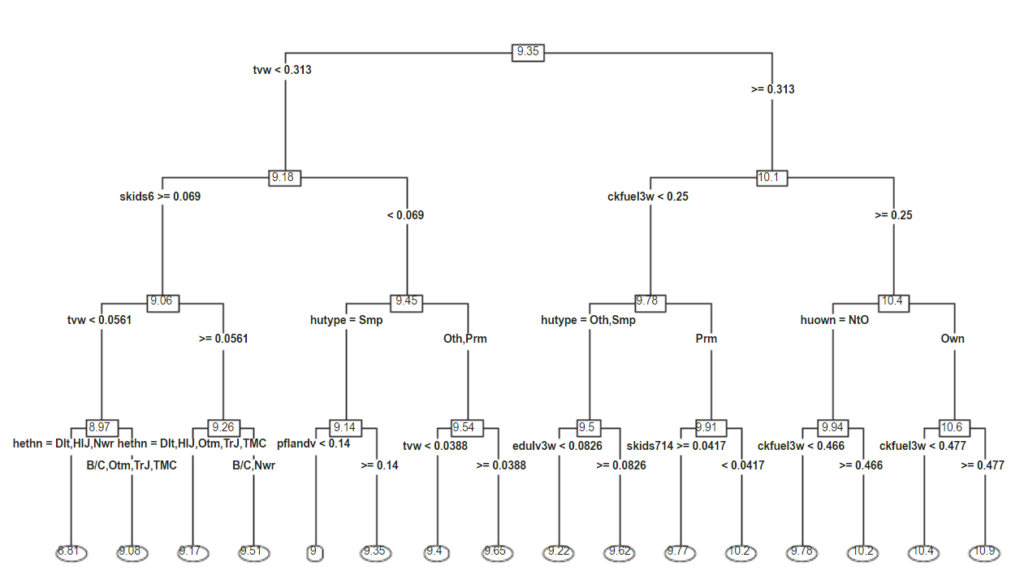
Summary: Poverty mapping is used to facilitate efficient allocation of aid resources, with the objective of ending poverty, the first of the United Nations Sustainable Development Goals. Levels of poverty across small geographic domains within a country are estimated using a statistical model, and the resulting estimates displayed on a poverty map. Current methodology for small area estimation of poverty utilises various forms of regression modelling of household income or expenditure. Fitting sound models requires skill and time, especially where there are many candidate regressors and even more possible interactions. Tree‐based methods have the potential to screen more quickly for interactions and also to provide reliable small area estimates in their own right. A classification tree technique has been presented by Bilton et al. (Comput Stat Data Anal115: 53–66, 2017) for estimating poverty incidence, but although adjustments were made to incorporate complex survey designs and estimate mean square error, classification trees are unable to estimate the associated non‐categorical deprivation measures of poverty gap and poverty severity. The focus of this paper is regression trees, because they enable all three core poverty measures of incidence, gap and severity to be estimated. Using regression trees, two alternative methodologies, parametric and non‐parametric, are explored for producing household level predictions that are then amalgamated up to small‐area level. New methods are developed for mean square error estimation. The properties of the small area estimates based on these regression tree techniques are then evaluated and compared with linear mixed models both by simulation and by using real poverty data from Nepal.
Mapping maternal healthcare access in selected West African countries
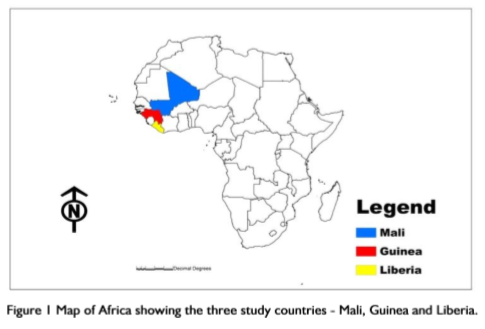
Benard Baffour, Alice Richardson, Dorothy N. Ononokpono
Background: The Sustainable Development Goal (SDG) three emphasizes the need to improve maternal and new-born health and reduce the global maternal mortality rate to less than 70 per 100 000 live births by 2030. Achieving the SDG goal 3.1 target will require evidence-based data on the distribution of maternal health outcomes and their linkage to healthcare access.
Data and Methods: This study used WorldPop data derived from an integration of satellite, census and household survey. Exploratory spatial analysis techniques were used to examine and visualize the spatial distribution of women of reproductive age (15-19 and 40- 44), live births and pregnancies at the subnational level in three “poor resource” West African countries: Mali, Guinea and Liberia. Buffer analysis was used to quantify the number of pregnancies within user-defined distances of a health facility.
Findings: Results showed wide variations in the distribution of maternal health outcomes across the countries of interest and districts of each of the countries. There was also clustering of maternal health outcomes and health facilities at the urban capital cities of Bamako, Conakry, and Greater Monrovia. A considerable number of pregnancies in most districts of northern Mali, northern and forest regions of Guinea and counties in south-eastern Liberia were not within 50km distance of a health facility, indicating inadequate access to maternal healthcare.
Conclusion: To bridge the gap in inequity in healthcare access, and improve maternal and newborn health in the study countries, there is need for equitable distribution of health resources and infrastructure within and across the disadvantaged districts.
Bayesian spatial modelling of early childhood development in Australian regions
Mu Li, Bernard Baffour, Alice Richardson
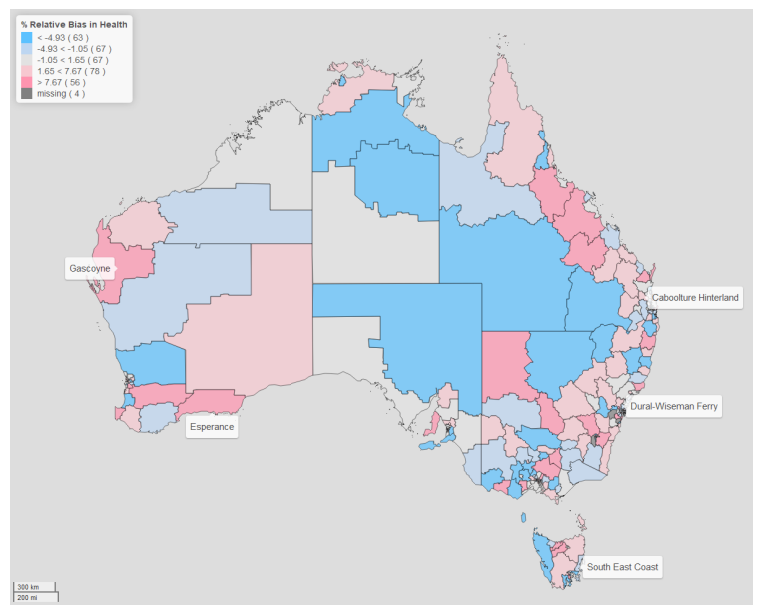
Background: Children’s early development plays a vital role for maintaining healthy lives and influences future outcomes. It is also heavily affected by community factors which vary geographically. Direct methods do not provide a comprehensive picture of this variation, especially for areas with sparse populations and low data coverage. In the context of Australia, the Australian Early Development Census (AEDC) provides a measure of early child development upon school entry. There are two primary aims of this study: (i) provide improved prevalence estimates of children who are considered as developmentally vulnerable in regions across Australia; (ii) ascertain how social-economic disadvantage partly explains the spatial variation.
Methods: The study included 308,953 children involved in the AEDC 2018 where 21.7% of them were considered to be developmentally vulnerable in at least one domain. We used Bayesian spatial hierarchical models with the Socio-economic Indexes for Areas (SEIFA) as a covariate for to provide improved prevalence estimates of all 335 SA3 regions in Australia.
Results: Our results reveal that there is an important geographical dimension to developmental vulnerability in Australia. In addition, there are significant improvements in estimation of the prevalence of developmental vulnerability through incorporating the socio-economic disadvantage in an area. These improvements persist in all five domains – the largest improvements occurred in the Language and Cognitive Skills domain.
Conclusion: There are a number of sparsely populated areas where direct estimation leads to unreliable estimates of the relatively small prevalence of child vulnerability. Bayesian spatial modelling can account for the spatial patterns in childhood vulnerability while including the impact of socio-economic disadvantage on geographic variation. Further investigation, using a broader range of covariates, could shed more light on explaining this spatial variation.